
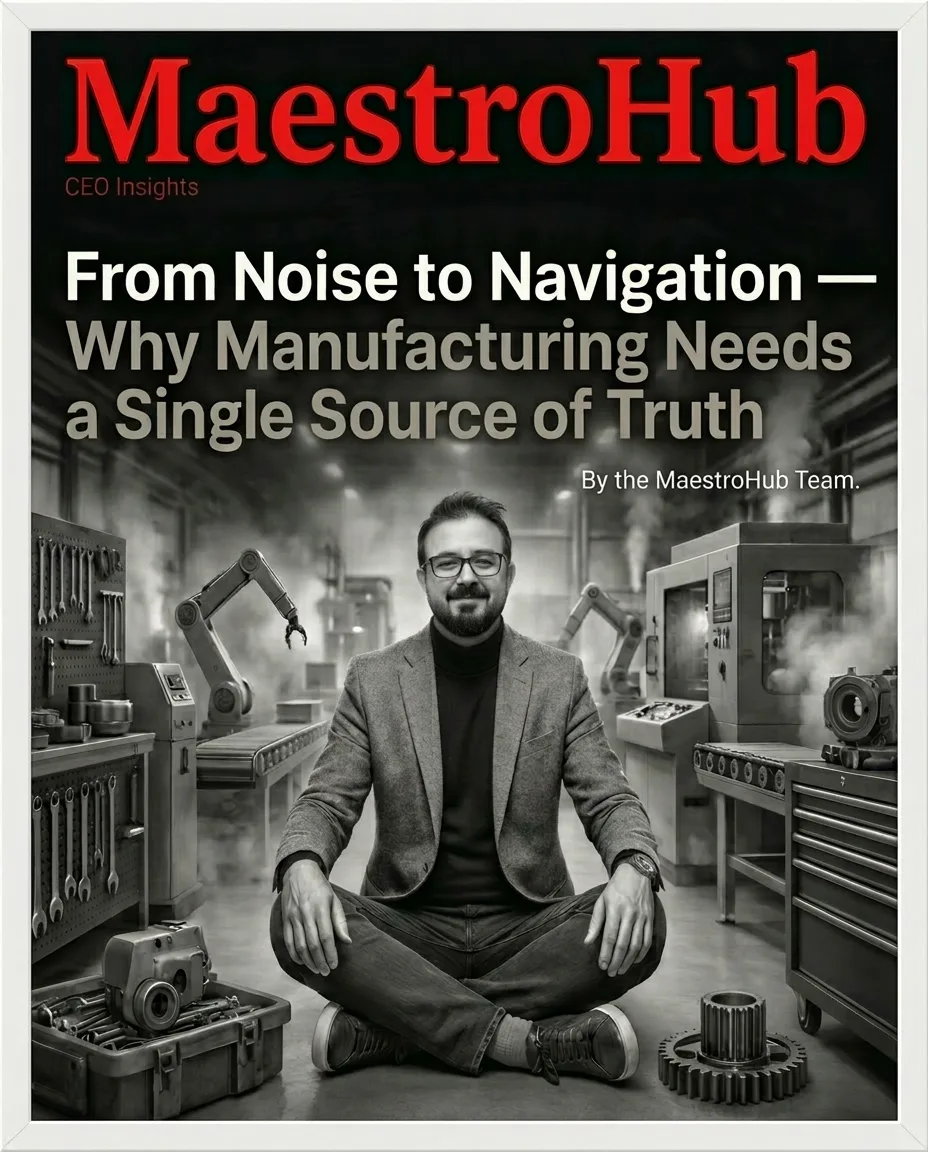
Why Modern Manufacturing Growth is About Speed, Not Just Scale
In modern manufacturing, growth is no longer constrained by capacity, it is constrained by latency. How fast can your organization see, decide, and act?
For decades, the standard manufacturing growth strategy was to add more: more machines, more plants, and more systems. Today, that formula is broken. Markets move faster, margins are thinner, and variability is higher. Leadership teams are now expected to respond in weeks, not quarters.
However, inside most industrial organizations, feedback loops remain dangerously slow. When performance data arrives late and KPIs lag reality, decisions trail events.
Growth stalls not because factories cannot produce, but because organizations cannot adapt. This gap defines the modern growth equation:
Competitiveness = Visibility × Velocity
- Visibility tells you what is happening.
- Velocity determines how quickly you can respond.
Most manufacturers have invested heavily in visibility but have vastly underestimated the critical need for operational velocity.
The Hidden Cost of Slow Feedback Loops in Operations
Slow feedback loops turn minor operational deviations into systemic growth constraints.
Every factory generates continuous signals: micro-stoppages, yield drift, energy spikes, and labor inefficiencies. Individually, these seem minor. Collectively, they define your competitiveness. The problem is timing.
In many organizations, the “Data-to-Decision” gap is too wide:
- Detection Lag: Operational losses are detected hours or days after occurrence.
- Reporting Lag: KPIs are consolidated weekly or monthly.
- Impact Lag: Financial impact is assessed only after the fact.
By the time leadership sees the issue, the opportunity to correct it has passed.
Research on Operational Latency
Recent data underscores the cost of this lag:
- McKinsey (2024) identifies slow decision loops as a primary reason manufacturing productivity growth remains below 1% annually.
- BCG notes that companies with rapid operational feedback cycles outperform peers on EBITDA growth by 5 to 7 percentage points over three years.
Speed is not about working harder. It is about shortening the distance between signal and decision.
Why Lagging KPIs Undermine Growth Strategy
Lagging KPIs optimize reporting, not performance.
Most executive dashboards still answer yesterday’s questions: What was OEE last month? How much scrap did we generate last quarter?
Real-time manufacturing growth requires leading indicators:
- Where is performance drifting right now?
- Which production line is becoming the next bottleneck?
- Which site is falling behind its peers this week?
According to Gartner’s Smart Factory Trends, organizations relying primarily on lagging indicators experience 30 to 40% slower improvement cycles compared to those using near real-time operational signals.
When feedback arrives too slowly, strategy becomes retrospective and management becomes reactive.
Reactive Management: The Silent Growth Killer
Reactive management absorbs leadership energy without compounding results.
When data arrives late, leaders compensate with instinct and escalation rather than evidence.
Common symptoms of a low-velocity culture include:
- Firefighting replacing strategic prioritization.
- Local optimizations conflicting with enterprise goals.
- Digital initiatives struggling to show ROI because results emerge too late.
In this environment, velocity collapses, not due to a lack of ambition, but a lack of trust in the data.
How DataOps Changes the Growth Equation
DataOps transforms growth by compressing feedback loops, turning visibility into velocity.
DataOps is not merely another analytics layer; it is an operational discipline ensuring data flows continuously and consistently across functions. By aligning OT (Operational Technology) and IT data into a unified model, DataOps enables:
- Near real-time performance visibility.
- Standardized KPIs across lines and sites.
- Immediate correlation between operational actions and financial impact.
When feedback loops shrink from weeks to hours, experiments become safer, and growth cycles shorten. Speed comes from clarity, but that clarity must arrive in time to matter.
Quick Wins Multiply When Feedback Is Immediate
Fast feedback turns improvement into a compounding system.
Manufacturers that adopt real-time operational visibility consistently report:
| Metric | Improvement Impact |
|---|---|
| Bottleneck Identification | 20 to 25% faster identification |
| Time-to-Impact | 15 to 20% reduction for initiatives |
| Digital Pilot Success | 2x higher success rates scaling to production |
Why? Because teams learn while acting. Adjustments happen mid-shift, not post-mortem. Best practices spread across sites before problems repeat.
Growth stops being episodic, it becomes continuous.
The CEO’s Mandate: Design Systems That Adapt
Modern CEOs no longer grow companies just by approving plans, but by designing systems that adapt faster than the market.
MaestroHub enables this DataOps-driven growth by unifying operational data into a live, governed performance layer, without replacing existing systems. Built by practitioners, MaestroHub focuses on one outcome: shortening the distance between signal and decision.
- Comes with 90+ connectors out of the box.
- Standardizes KPIs across lines and plants.
- Delivers measurable impact within 60 days.