
“It Works in the Demo” Proves Nothing
Every industrial data platform works in the demo. The network is clean, the disk is empty, the clock is right, and nobody pulls a cable. None of that is true at the edge for long.
A demo walks the happy path, and the happy path is the one part of a system that almost never needs defending. What decides whether you can trust a platform is everything else: what it does when the disk fills during a long outage, when a process is killed in the middle of sending a backlog, when the clock jumps two hours, when a link stops answering but does not close.
My position is that you cannot learn those answers by reading code, by writing more unit tests, or by waiting for production to teach you. You learn them by causing the failures yourself, on purpose, against the real product, and then counting what is left. A claim about reliability that has never met its own failure modes is a hope.
This article is about doing exactly that to our own store-and-forward, the part of MaestroHub that holds data while a destination is away. It is also about what broke, because some of it did.
What We Broke, on Purpose
We did not mock the faults. We ran the whole application against real engines, made the operating system misbehave underneath it, and kept data flowing the whole time.
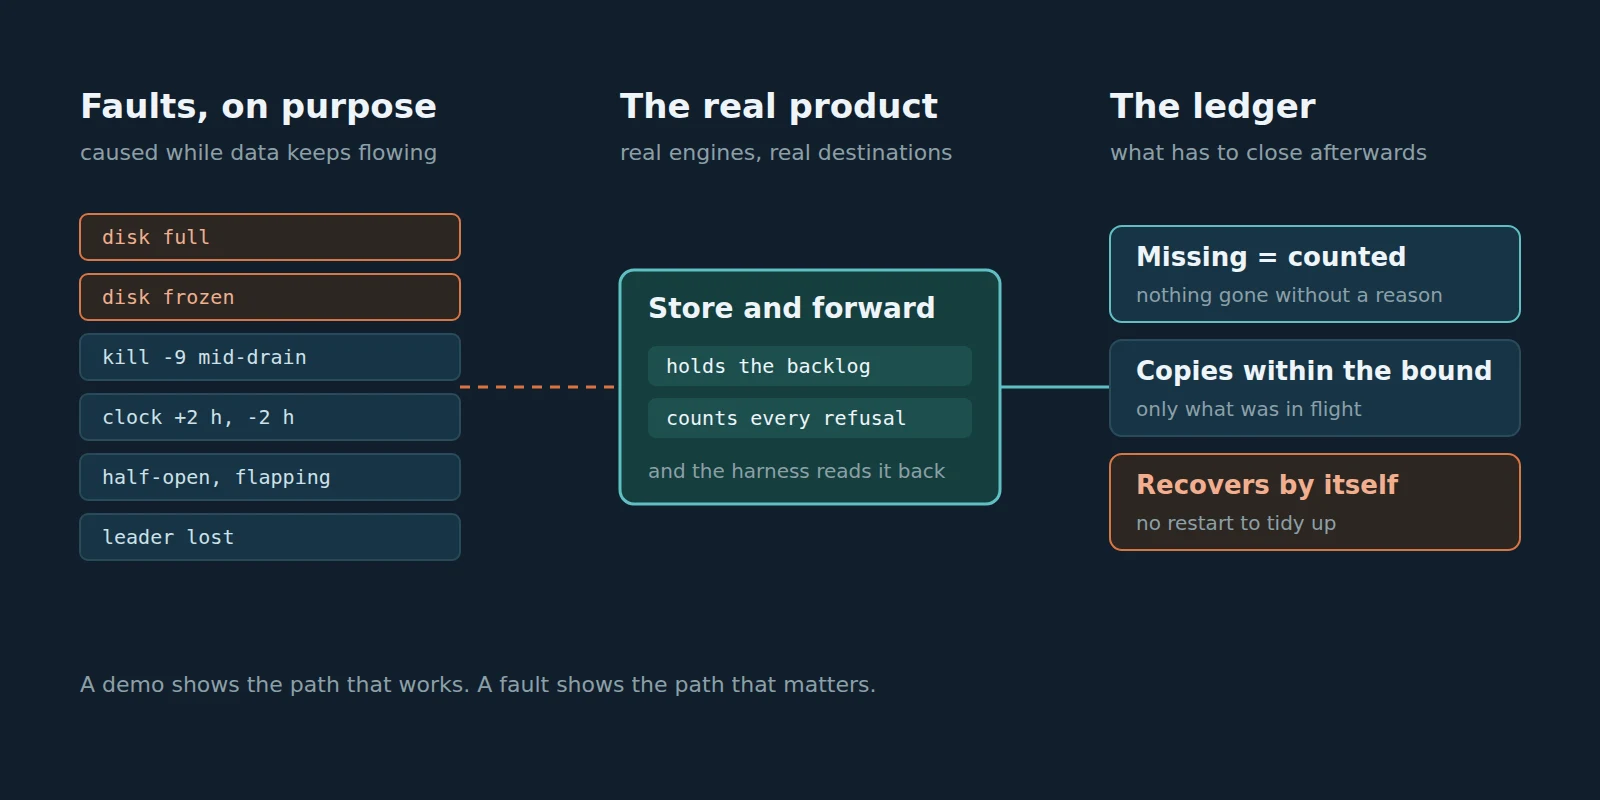
The main rig starts the complete product, not a module in isolation, and sends a steady stream of writes through a pipeline into a real Kafka cluster behind a proxy, with the output set to deliver in order. Then it breaks something. The disk under the data directory is a small virtual volume we can fill, freeze or slow down from outside. The network to the broker runs through a proxy and through the kernel’s own traffic shaping, so we can add latency and loss, or leave the link half open. Other rigs kill the process with kill -9 mid-drain, step a three-node cluster through leader changes, and cut eight other connector setups for fifteen minutes each.
A fault is only useful if you decide in advance what “survived” means. Ours had four rules, checked after every run:
- Nothing missing that was not counted. Every write the destination does not have must be in a ledger with a reason: refused, evicted, kept in Failed messages. Missing minus counted has to be zero. That difference is the silent loss, and it is the only number that is never acceptable.
- No copy beyond the bound. Store-and-forward here promises at least once, so a write that was in flight at the exact moment of a fault may arrive twice. More than that is a bug.
- It recovers by itself. Every write sent right after the fault ends has to land, without anyone restarting anything.
- The rest of the system keeps answering. Sign-in, health and reads are probed during the fault. A data platform that survives a fault by going unreachable has not survived it.
Key idea
Before you inject a fault, write down what surviving it means, as numbers you will check. Without that, every run passes, because you are reading the result in the most charitable light.
What Held
Most of the faults did nothing interesting, which is exactly what you want from them. Every run below read each record back from the real destination and counted what was missing, what arrived twice and what arrived out of order.
The network. Two seconds of extra latency each way for three minutes, a half-open link that accepts bytes and never answers, a link that went down for ten seconds in every twenty for five minutes, and ten percent packet loss with extra delay. Between 9,600 and 15,600 writes per run: none missing, no copies, none out of order.
The process. The process was killed with kill -9 three times during a single drain of 600 writes. Nothing was missing. The copies matched the bound exactly: in one run, 21 extra records for 21 writes that were in flight at the moment of a kill; in the in-order run, 24 for 24, and nothing out of order. A clean restart in the middle of an outage with 5,688 writes held: 10,527 writes in all, none missing, no copies. The same with the process limited to five percent of one CPU core through the whole drain: slower, and nothing else.
The clock. With a backlog of 3,981 writes held, we moved the machine’s clock two hours forward and two hours back. Nothing expired, nothing was refused, the backlog stayed whole. After the link healed, 4,480 writes sent, 4,480 delivered, no copies, none out of order. Any part of a buffer that decides by wall-clock age is exposed by exactly this test.
The cluster. On a three-node cluster, the leader of the buffer’s stream handed over twice and was then stopped for twenty seconds while a backlog of 3,000 drained and new writes kept arriving: 5,396 writes confirmed, none missing, no copies, none refused. Replica moves with a write in flight: eight cases, at most one copy each, only of the write that was in hand.
Long cuts. A fifteen-minute cut, with the real engine side draining afterwards, on AMQP 1.0, RabbitMQ, NATS core and JetStream, PostgreSQL, REST, and MQTT 3.1.1 and 5.0: between 42,000 and 47,000 writes per run, none missing. One REST run delivered one extra copy, which is inside the bound for an API that has no key to recognise a repeat. And one cut of six hours, on the release candidate: 1,080,005 readings, none missing, none duplicated, none out of order, none failed.
Across every run we also watched the process itself: goroutines, open file handles and memory stayed in a narrow band, with no growth from one run to the next.
A Full Disk That Went Quiet
The disk is where the product broke, and it broke in the worst way: quietly.
Edge machines have small disks, and an outage is exactly when a disk fills, because the buffer is doing its job. MaestroHub keeps a free-space floor on its data volume and refuses new data at it, with a reason, rather than filling the disk to the last byte. We knew that part worked. What we had not tried was the edges around it.
Three things went wrong.
The wrong reason. When the room above the floor ran out, the first few hundred writes were refused as “message too large”, with advice to raise the buffer’s capacity. They were counted and kept, so nothing was lost, but an operator would have been sent to fix the wrong thing, and the output’s own policy for a full buffer was never consulted. The fix separates “this message can never fit” from “there is no room right now”, and the second one goes through the policy the operator chose.
A volume that could not boot. On a volume with less than about 5 GB free, the application refused to start, because the platform’s own internal streams reserved more space than the automatic floor left them. The machine that most needs to show you “your disk is nearly full” never came up to show it. After the fix, volumes of 1, 3, 4 and 5 GiB all boot.
The silent one. Then we took the volume to zero bytes, the way another program on the same machine might, and freed it again. Writes were refused and counted, as designed. But the embedded message store that holds the buffer had met a failed write on a full disk, and from then on it refused that stream until the process restarted. With the link back and the space free, the backlog barely moved: a few dozen writes, over minutes. Audit records timed out. Sign-in stopped answering. And nothing anywhere said why.
No buffered data was lost: after a restart every missing write matched a counted refusal. Some audit records were lost while the store refused them, each one logged. But this is the exact failure a field engineer meets at the worst moment: the disk problem is gone, the system looks alive, and nothing moves.
The fix came in two steps. First the system had to say so: the engine’s health now names the stream that cannot be written, with the remedy. Then it had to heal: once the volume is back above its floor, the product reopens its message store from the files on disk, inside the running process, and store-and-forward resumes. The first version of that reopen did not bring back the pipeline run queue, which on the default edge setup lives in memory, not on disk, so every pipeline run failed afterwards. The rig caught it on the next run, and the reopen now carries the in-memory streams across too.
A Frozen Disk That Froze Everything
A full disk refuses writes. A frozen disk is worse: it accepts them and never finishes.
Disks freeze more often than people expect. A storage snapshot pauses the volume. A failing drive stalls. A virtual disk waits on a busy host. We froze the data volume for 45 seconds, then for six minutes, while an outage was in progress.
The data survived. Nothing was missing, nothing was copied, order held, and one write whose publish ran out of time was kept as “possibly delivered” and then delivered once. But the whole process stopped. In a short freeze the application’s own heartbeat went silent for almost the whole freeze. Not just the store: everything.
We found the cause from goroutine dumps, one layer at a time. The embedded SQLite databases kept their write-ahead index in a file mapped into memory from the data volume. When the volume froze, one thread touched that mapped page and hung inside the kernel, and the Go runtime, which needs every thread to pause briefly for garbage collection, waited on it. One frozen page stopped the world. Moving that index into ordinary memory fixed the first layer. Then health checks were found waiting on the frozen store, then sign-in, then reads, each behind a call that waited on the frozen disk. Each was found by freezing the disk again and reading the next dump.
After the fixes, a 90-second freeze looks like this. Health answers immediately and says the data volume has not finished a write for so many seconds. Sign-in answers with a refusal and a plain reason, because a session that cannot be stored is a session the system will not recognise later. Reads answer. After the thaw, every write that did not arrive is accounted for: kept in Failed messages for replay, or counted as not kept. Nothing was copied, nothing was out of order, and every write sent after the fault landed.
There is a price, and it belongs in the open. With the index in ordinary memory, the running server holds its SQLite databases exclusively. The command-line admin tool can no longer open them while MaestroHub runs; you stop the server first, and the tool now tells you so with the exact steps. The trade-off is a system that keeps answering during a frozen disk, against the convenience of an offline tool that worked while the server ran.
The Test Was Wrong Too
A chaos rig is software, and it fails like software. Half the skill is not believing it too quickly.
Our first fifteen-minute cuts on MQTT and REST reported about 170,000 extra copies. The product had sent at most one. The rig counted a copy every time one message body contained another, because the bodies were not self-delimiting. The clock-jump run reported thousands of failed requests; the product was right to refuse them, because the rig was using an access token issued on the other side of a two-hour jump and never signed in again. The rig counted Failed messages from the first page only, and missed most of them. It tried to thaw the frozen volume from inside the frozen process, and deadlocked itself.
Every one of these looked, for a while, like a product bug or a product pass. The defence is the same as for the product: every number the rig reports has to be explainable from first principles, and a suspicious result is a finding about the rig until proven otherwise. The bounds in our rules helped here. “Copies equal the writes in flight at a kill” is a precise prediction; 21 for 21 is a pass you can believe, and 170,000 is a rig you cannot.
How Each Fix Was Proven
Every fix in this campaign followed the same order: a failing test first, then the code, then the original fault again on the same rig.
The failing test is what makes a fix honest. “The store refuses writes after the disk is freed” became a test, against a real embedded server on a tiny volume, that failed before the change. “A read waits behind a held write” became a test that ran out of time before the change. Then the same disk was filled or frozen again, the same ledger was closed, and the same four rules were checked. Then the full test suite ran, because a fix in shared storage code can break something three modules away.
Each of the four disk faults went through that loop, some of them more than once, because a fix often uncovers the next layer. That is the real return on chaos testing: not the first bug, but the chain of bugs behind it that no one would have imagined from the design.
Questions to ask of your own platform, or of any vendor's.
- What happens to buffered data if the disk fills during an outage, and how would you find out a write was refused?
- When the disk has space again, does the system resume by itself, or does someone have to restart it?
- If the data volume freezes for a minute, do health checks, sign-in and reads still answer?
- Kill the process three times while it drains a backlog. How many copies arrive, and can you predict the number in advance?
- Move the clock two hours. Does anything expire, get refused or get dropped?
- After your last fault, did "missing" equal "counted"? Did anyone check?
Where This Stands, Honestly
The fixes described here are in MaestroHub 3.1. A few things are worth saying plainly.
These faults ran on a test machine with a virtual disk we could fill and freeze from outside, and real engines in containers. Your hardware will find faults we did not think of. The clock jumps ran once in each direction, on an idle machine.
Store-and-forward keeps an at-least-once promise. A write that is in flight at the instant of a crash or a half-failed link may arrive one extra time, and the kill tests show that bound is real, not theoretical. Delivery is in order when the output is set to In order or its connector asks for it; the main rig used In order, and the kill test ran both.
A full disk still refuses data. That is the design: at the floor, new writes are refused and counted, rather than the disk filling to the last byte and taking the rest of the system with it. How long a buffer can hold depends on your data rate and your disk, and the product warns you as room runs low rather than promising a number of days. If the store’s own reopen ever fails after a full disk, the health says so and a restart is the last resort; we did not see that happen in any run.
The Question I Want to Leave You With
What is the worst fault your platform has ever been put through on purpose?
If the honest answer is “the demo”, then nobody knows yet what it does on its worst day, including the people who built it. We did not know either, until we filled the disk and watched the buffer go quiet. I would rather find that on a test machine on a Monday than have a customer find it at a plant on a Sunday night.
If you want to compare notes on how you test your own edge systems, or see these faults run against MaestroHub, get in touch.